A STATISTICAL LOOK AT WHAT THE PAST HAS TO SAY ABOUT THE FUTURE’S ALL STARS
Written By: Torsten Maier (August 7, 2017)
Inevitably, a handful of tomorrow’s All-Stars will have been picked in the recent
2017 NBA Draft. In this article, we’ll discuss a few interesting statistics that will shine
some light on how many All Stars will come from this draft and where in the draft they
will have been picked from.
THE METHOD
It’s important to note that the analysis for this article was done for 49 first rounds
(1965 – 2013). 1965 was chosen based on access to historical data. 2013 was chosen
as the cut-off year because players drafted after this time have not had enough time to
accumulate at least one All Star appearance. The player list and pick information from
these drafts were cross referenced with a historical list of All-Stars to match each All
Star with their draft selection. Then, the percentage of players who became All Stars for each draft pick was calculated by dividing the number of All Stars selected with that
pick by the total number of players selected with that pick (49, one for each year).
THE RESULT
For those who read the last page of a book first, this is for you. The graph below is the final product of the analysis. The chart shows the percentage of draft selections for each pick with at least one All Star appearance. Now let’s look at what this graph can teach us.
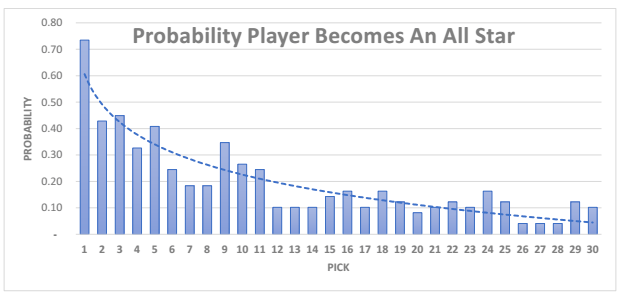
GOOD NEWS FOR MARKELLE FULTZ

This graph should make Markelle
Fultz very excited. Nearly three out of
four #1 overall draft picks become All
Stars (73% to be exact). To the right is the
list of #1 overall picks who didn’t become
All Stars. As Markelle appears not to be a
reach like Anthony Bennett, it seems
most likely that only a major injury (such
as Greg Oden) could derail his rise to All
Star status.
BAD NEWS FOR 6, 7, &, 8
The Orlando Magic, Chicago Bulls (via the Minnesota Timberwolves), and the New
York Knicks are not going to like this graph. Over the past 50 years, there has been a
noticeable lack of All Stars at 6, 7, and 8 compared to the picks around them. The
probability of those 3 picks are 19% lower than the 3 picks before (3, 4, and 5) and 9%
lower than the 3 picks after (9, 10, and 11). Bad news for three franchises that badly
need to beat the odds.

MAYBE THE LOTTERY SHOULD END AT 11
From 12 and on, the percentages are nearly constant, with the probability
teetering above and below 10%. It might be good for teams considering trading up into
the late lottery range (12-14) to consider that just as much value has been found in the
later stages of the draft (15-25). Although these picks are highly coveted as “lottery
picks”, they appear to be out of family with the rest of the “lottery selections”.

SO HOW MANY ALL STARS SHOULD I EXPECT?
Now that we know the odds, let’s check how many players we can expect to be suiting up in upcoming All Star games from this year’s draft. All in all, the numbers come out to roughly 6 total players per draft that make at least one All Star appearance; between 2 and 3 come out of the Top 5 and between 1 and 2 come from picks 6-14 and picks 15-30 each.
FINAL REMARKS
I hope this article has helped you learn a useful thing or two about the first round
of the NBA Draft. If not useful, hopefully you’ve at least learned some fancy new stats
to throw around at this year’s fantasy draft to look like the room’s go to NBA expert.
